Replaying a 2010 El Clásico as a Live Fabric App with Rayfin
A 2010 Barça–Real Madrid match replayed event by event in Microsoft Fabric, with Rayfin providing the app backend, predictions and Entra sign-in.
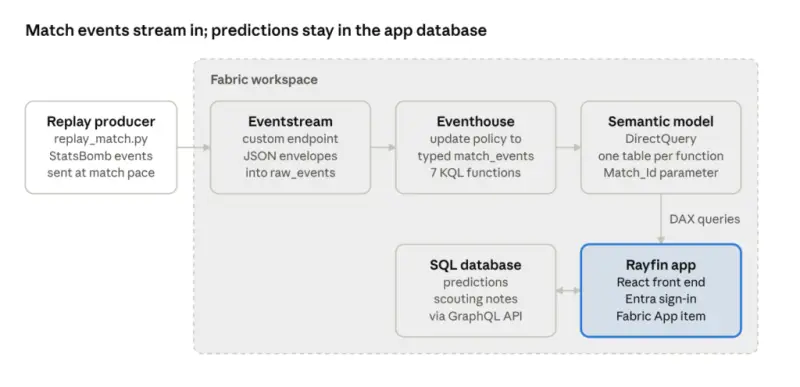
Barcelona beat Real Madrid 5-0 at Camp Nou on 29 November 2010. Fifteen years later, that match can be replayed event by event on a pitch inside Microsoft Fabric. Xavi scores at 9′, Pedro at 17′, Villa twice after the break, and Barcelona's xG line climbs to 2.77 while Madrid's stays flat at 0.13. The interesting part isn't the nostalgia. It's that a single workspace now holds the streaming data, the analytics, the semantic model and a sign-in-protected web app, and that Rayfin ties them together.
What the build actually contains
Football data splits into two very different workloads. Match events are read-heavy analytics: thousands of passes and shots, rolled up into xG, momentum and pass networks. User data is the opposite. A prediction or a scouting note is a small write that has to land reliably in a database. Fabric has long handled the first kind well. Rayfin, an open-source SDK and CLI from Microsoft, adds the second. You define entities in TypeScript, and rayfin up provisions a Fabric SQL database, a GraphQL API, Entra sign-in and static hosting for the front end, all as one item in your workspace.
The match center uses both paths:
- Ingestion. A Python producer replays StatsBomb events into an Eventstream custom endpoint at a chosen speed.
- Eventhouse. Events land as JSON in
raw_events. An update policy flattens them into a typedmatch_eventstable. Seven KQL functions handle the football maths:Scoreline,XgRace,Momentum,ShotMap,PassNetwork,PlayerStatsandKeyMoments. - Semantic model. A DirectQuery model with one table per KQL function and a single
Match_Idparameter. The app sends DAX to it, so every number comes from one governed place. - Rayfin app. A React front end deployed as a Fabric App item. It reads match data through the semantic model and writes predictions to its own SQL database through the generated GraphQL API. Users sign in with their Entra account and install nothing.
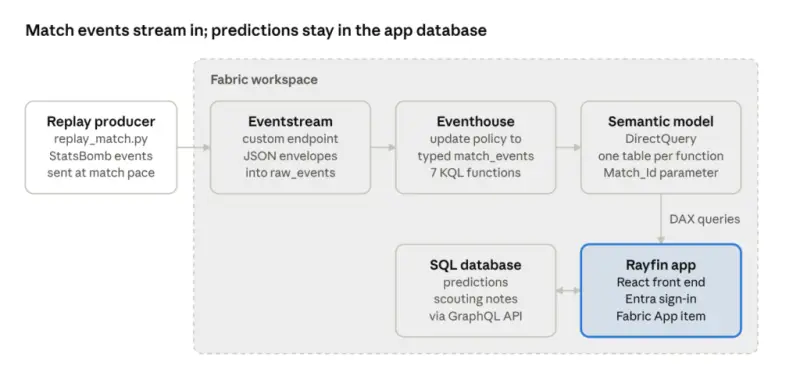
Everything except the producer lives in one workspace. The read path for match data runs across the top of the diagram, while the app's own SQL database, provisioned by Rayfin, stores what users write.
Turning a 2010 match into a live feed
Real live feeds come with commercial contracts, which makes them the wrong starting point for a demo. StatsBomb open data is free for non-commercial use and covers La Liga seasons from the Messi era, event by event. The 5-0 Clásico is match 69299, with 3,975 events. Each one carries a timestamp, a team, a player, pitch coordinates and, for shots, StatsBomb's xG value.
The producer, ingest/replay_match.py, keeps the 1,565 events a match center needs: passes, shots, dribbles, duels, cards and substitutions. It drops ball receipts, carries and pressures. It then sends each event at the moment it happened on the pitch, scaled by a --speed flag, and skips the half-time break. At --speed 10, the full match replays in about nine minutes. Each message is a small envelope with a match_id, an emitted_at timestamp and the event itself under content.
Deploying it with one command
The architecture lives in the repo as code. The KQL schema is a script, the Eventstream is a JSON definition, the semantic model is TMDL, and the app is TypeScript. A single Python script pushes all of it to a workspace through the Fabric and Power BI REST APIs, then deploys the app with the Rayfin CLI. The only browser step is signing in.
Prerequisites
- A Fabric workspace on a capacity (an F2 or the trial is enough), where you hold the Admin or Member role
- The Fabric apps tenant setting enabled by a Fabric admin
- Python 3.10+, Node.js 20+ and the Azure CLI on your machine
- Your tenant ID and workspace ID. Both appear in the browser address bar when the workspace is open:
app.fabric.microsoft.com/groups/<workspace-id>/...?ctid=<tenant-id>
The sequence
Replace each placeholder, angle brackets included. Clone the repo, open a PowerShell terminal in its folder, then run the following steps in order.
- Sign in to Azure and install the producer's single dependency:
az login --tenant <tenant-id>
python -m pip install -r ingest\requirements.txt
2. Preview the plan. Nothing changes:
python fabric\deploy\deploy.py --tenant-id <tenant-id> --workspace-id <workspace-id> --dry-run
3. Deploy. The first run takes about 15 minutes, most of it spent on Fabric provisioning:
python fabric\deploy\deploy.py --tenant-id <tenant-id> --workspace-id <workspace-id>
4. Replay the match. The producer reads the Eventstream connection string from the Fabric API using your az login token, so there's nothing to copy by hand:
python ingest\replay_match.py --events ingest\data\events_69299.json --speed 10
5. Check the full chain:
python fabric\deploy\08_verify.py
6. Open the Fabric App item rayfin-football in the workspace.
What the deploy touches
| Step | What happens |
|---|---|
| 1. Eventhouse | Creates EH_Football and its KQL database, or reuses them |
| 2. KQL schema | Runs the schema script: tables, mapping, update policy, 10-second batching, the seven functions |
| 3. Eventstream | Creates ES_MatchEvents from its definition: custom endpoint into raw_events |
| 4. Semantic model | Uploads Football_Model from TMDL, pointed at your Eventhouse |
| 5. Credentials | Sets the model's data source to end-user sign-in, so each user queries the Eventhouse as themselves |
| 6. App config | Writes the model ID into the app's environment files and rayfin.yml |
| 7. App deploy | Runs rayfin up: the Fabric App item, its SQL database with the Prediction, ScoutingNote and WatchedMatch tables, the GraphQL API and the built front end |
Each step is safe to re-run, and items already present under the default names are reused. After a full replay, the verify script should report Barcelona with 5 goals from 14 shots, xG of 2.77 and 723 passes at 88.1%. Real Madrid should show 0 goals from 5 shots and xG of 0.13.
To replay the match again, clear the tables from a KQL queryset with .clear table raw_events data and .clear table match_events data. If you change one component, re-run only its step. For example, after editing the KQL, deploy.py --only 2 is enough.
The front end
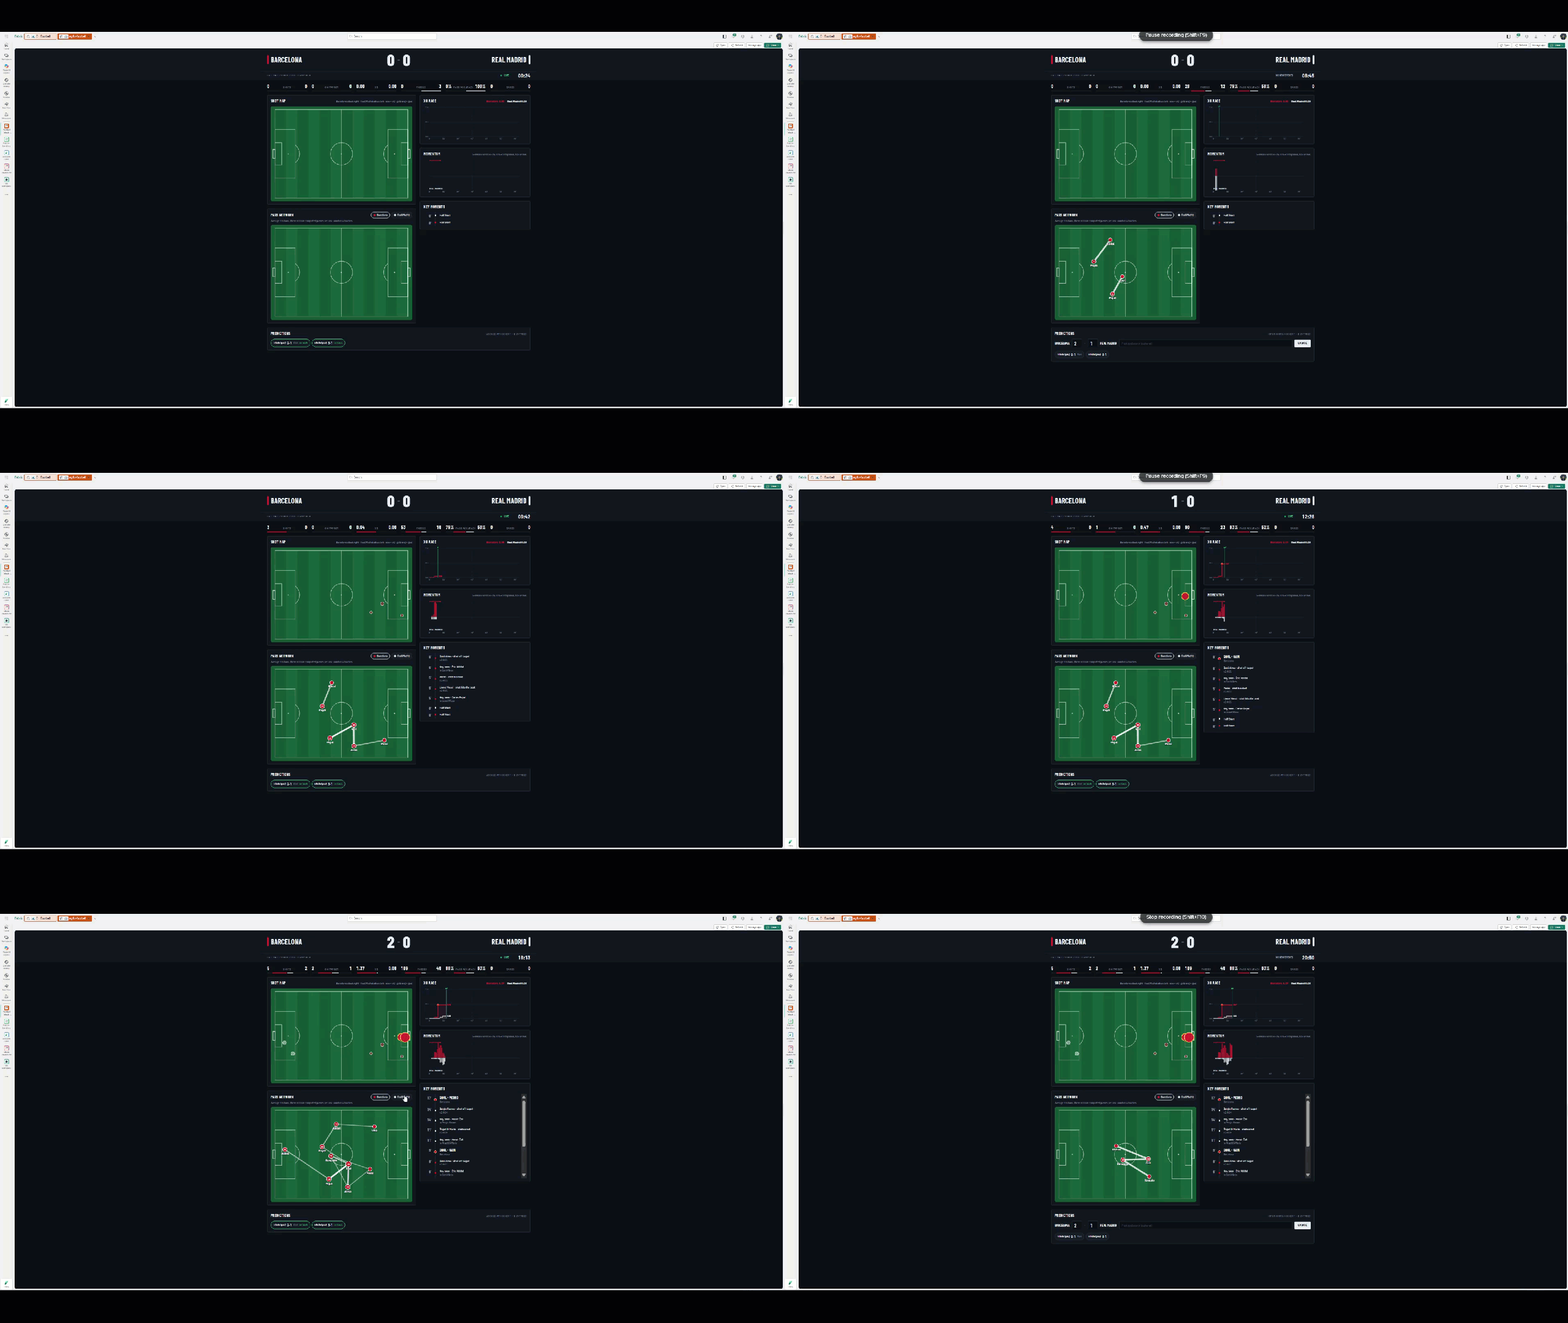
The first version looked like a standard dashboard. The second borrows from TV broadcast graphics: a dark pitch, the two team colours as the only strong colours, condensed type for every figure, and the score as the largest element on screen.
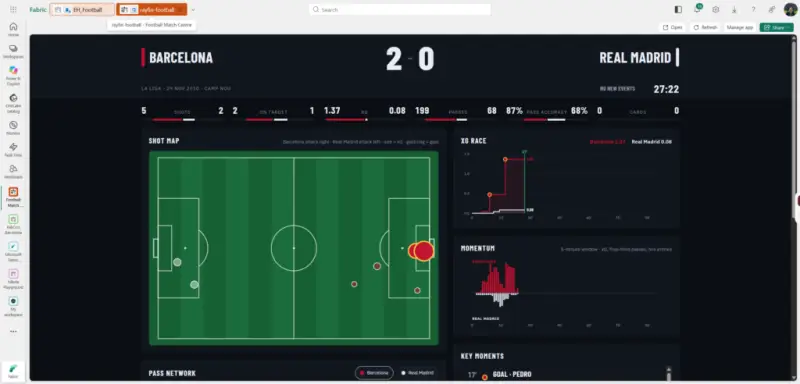
What appears on screen:
- Scoreboard. The score, a pulsing LIVE marker and a match clock that ticks every second. When a goal goes in, the scoring team's colour sweeps across the strip alongside the scorer's name.
- Stat bars. Shots, shots on target, xG, passes, pass accuracy and cards, each bar filling toward its team's side.
- Shot map. Both teams on one full pitch, with Barcelona attacking the right goal and Madrid the left. StatsBomb records every team as attacking left to right, so the away team's coordinates are mirrored. Marker size follows xG, and goals get a gold ring.
- Pass network. Average player positions and the passing links between them, with a Barcelona / Real Madrid toggle. In this match, the chart shows Xavi at the centre of nearly everything.
- xG race and momentum. Cumulative xG for each team, plus a mirrored momentum chart built from shots, final-third passes and box entries over a five-minute window.
- Key moments. A timeline of goals, shots, cards and substitutions, using common player names, so it reads "Xavi" rather than the full registered name.
- Predictions. Before kickoff, every signed-in user can predict the score and the first scorer. The form locks when the match goes live, and any prediction that's still mathematically possible turns green. This is the part running on Rayfin's own SQL database.
Predictions: the part that writes
Predictions are what turn this from a report into an app. Before kickoff, each signed-in user submits a score and, optionally, a first goalscorer. That's a write: one row per user per match in the app's SQL database, editable by its owner until the match goes live.
In Rayfin, the entire backend for that is one TypeScript class:
@entity()
@role('authenticated', ['read'])
@role('authenticated', ['create', 'update', 'delete'], {
policy: (claims, item) => claims.sub.eq(item.user_id),
})
export class Prediction {
@uuid() id!: string;
@int() match_id!: number;
@int() home_goals!: number;
@int() away_goals!: number;
@text({ optional: true }) first_scorer?: string;
@int({ optional: true }) points?: number;
@boolean() locked!: boolean;
@text() author!: string;
@date() createdAt!: Date;
@text() user_id!: string;
}
rayfin up turns that into a table, a GraphQL API and a permission rule. Every signed-in user can read every prediction, since a leaderboard with hidden rows wouldn't be much use. Only the owner can create, change or delete one. The server checks the sub claim in the user's Entra token against user_id, so an edit to someone else's prediction fails even if the request has been tampered with. The front end calls client.data.Prediction.create(...) and update(...), typed against the same class, so a misspelled field fails at compile time.
During the match, the app compares each prediction with the live score. The points column is there for settling the game at full time, but that scoring logic isn't built yet.
Power BI can write back as well. Translytical task flows let a button in a report call a Fabric User Data Function that inserts, updates or deletes rows. That suits an action inside a report, such as approving an order or correcting a record. The difference is where the write lives. In a report, it's an action attached to a visual. In a Rayfin app, the write is part of the data model itself, with its permissions declared alongside it and a UI built around it.
Where the AI coding assistant fit in
An AI coding assistant wrote most of the code: the replay producer, the KQL schema and functions, the Rayfin entities, the TMDL semantic model, the React app, both interface designs and the deployment scripts. The developer supplied the brief, made the design decisions, ran the iterations and tested every piece against their own tenant.
That last step matters. The assistant can't see a Fabric tenant, so it only learned whether its code worked when someone ran it and reported the error. Some of the failures were its own guesses, including a rayfin config command that doesn't exist and KQL variables named after reserved words. Each fix took one round trip: paste the error, identify the cause, re-run.
The assistant also caught problems earlier by testing the deploy scripts against a mocked Fabric API. That run found three bugs nobody had seen yet: the KQL script was being split into 16 broken fragments, the model ID was written to a file the app never reads, and the pass network query needed one call per team instead of one overall.
Where this goes beyond a classic Power BI report
The most striking thing here is how far the build moves past a traditional BI tool. The match center goes further than a classic Power BI report in four ways:
- It writes. Predictions are part of the app's own data model rather than an action bolted onto a report. Each one lands in a SQL table, and only its owner can change it, enforced on the server by a single entity decorator,
claims.sub.eq(item.user_id). - It moves. The clock ticks every second, the score updates and a goal sweeps the team colour across the screen. A report refreshes on a schedule, whereas an app can respond to what's happening.
- It looks like the subject. A full pitch with both goals, mirrored coordinates and a broadcast-style scoreboard required no custom visual SDK. It's SVG inside a React component.
- It stays in Fabric. The numbers still come from one semantic model, users sign in with Entra, and everything sits in the workspace beside the data under the same governance.
It isn't free of trade-offs, though:
- Rayfin is in preview. During this build, the service began requiring a newer CLI than the project had pinned. Upgrading to version 1.36 changed the client API in two places.
- It's code. Someone has to write and maintain a React app. A report author without a developer on hand is still better served by Power BI.
- The Eventhouse consumes capacity. An always-on Eventhouse is the largest consumer in this setup, so size the capacity with it in mind.
Trying Rayfin yourself
If you work with Fabric, Rayfin is worth a look. Start small: npm create @microsoft/rayfin@latest scaffolds a working app with sign-in and a data model, and npx rayfin up deploys it to your workspace. The awesome-rayfin gallery has templates to learn from. The Helsinki Public Transport template is the closest match to this project, and the deploy scripts here started from its own.
To run the match center itself, clone the repo and follow the steps above. Note the licensing. StatsBomb open data is for non-commercial use with attribution, which makes it a fit for demos and talks rather than a paid product. The deploy scripts and query transport code are adapted from the MIT-licensed Helsinki template.
My read is that the most useful takeaway isn't the football. It's the pattern: read-heavy analytics in Eventhouse and a semantic model, plus a small transactional write path in the same workspace. If your team already keeps its numbers in Fabric, that split is worth prototyping before you reach for a separate web stack.


